Wowza Community

Monitor Wowza/JVM metrics with prometheus

I spent a few hours figuring out how to monitor Wowza with prometheus. Sharing it here for others

1. Get the compiled jmx_prometheus javaagent and create the config.yaml for it

mkdir /opt/jmx_prometheus
cd /opt/jmx_prometheus
https://repo1.maven.org/maven2/io/prometheus/jmx/jmx_prometheus_javaagent/0.15.0/jmx_prometheus_javaagent-0.15.0.jar
echo '---
startDelaySeconds: 0
ssl: false
lowercaseOutputName: false
lowercaseOutputLabelNames: false' > /opt/jmx_prometheus/config.yaml

2. Add javaagent to Wowza Tune.xml and restart

Add it to the VMOptions section

<VMOptions>
            <VMOption>-javaagent:/opt/jmx_prometheus/jmx_prometheus_javaagent-0.15.0.jar=8081:/opt/jmx_prometheus/config.yaml</VMOption>

3. Restart wowza

systemctl restart Wowza*

4. Check your metrics

curl http://localhost:8081/metrics

That’s it! Look at the jmx_exporter repo for instructions on how to limit what metrics are shown to reduce load on Wowza server.
4 Likes

Thanks, this was very helpful!
On the second line, I think you forgot to add wget or a similar curl command to download the jar file:

wget https://repo1.maven.org/maven2/io/prometheus/jmx/jmx_prometheus_javaagent/0.15.0/jmx_prometheus_javaagent-0.15.0.jar

I’m curious if you have any Prometheus queries that you have found useful for monitoring Wowza? I am just getting started with Prometheus & Grafana, so open to any suggestions.

2 Likes

I am curious to a different question here.

Why is Prometheus/Grafana more useful than wse manager here? What additional metrics are you I measuring?

I can’t edit my post to add wget but at least someone can read yours.

The agent exposes metrics starting with these names

java_lang_*
jvm_*
WowzaStreamingEngine_*

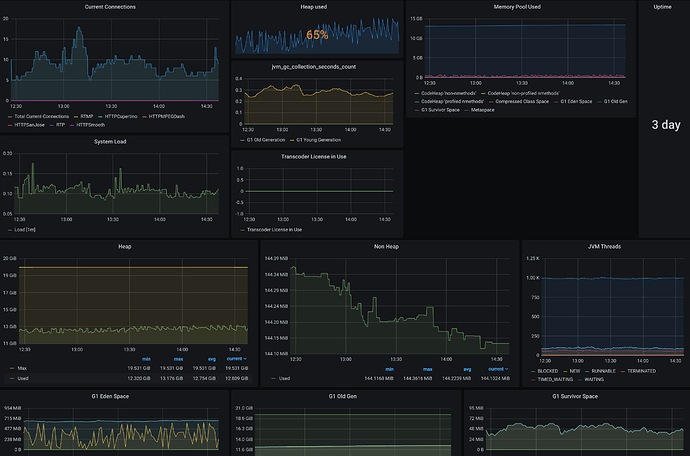
I started with this dashboard: https://grafana.com/grafana/dashboards/14359 that already monitors jvm metrics. Then I created a single graph for all the WowzaStreamingEngine_Connections*_current metrics.

In my implementation, Wowza does not release memory properly and has to be restarted on a schedule to maintain good performance. I wanted to get a better idea of what was going on internally so I’m mainly looking at connection counts and the different jvm memory pools.

2 Likes

I use Grafana already so I find it more convenient when I can look at all metrics in one place.

When I was investigating Wowza memory usage, after reading articles like these: https://spring.io/blog/2019/03/11/memory-footprint-of-the-jvm , I thought it would be useful to monitor the JVM internals which WSE does not provide.

Ah I see jvm stats ofcourse !

1 Like

do you can share dashboard the WowzaStreamingEngine by file json

Hello do you mean share the dashboard and stream data with a team member but without full admin access?

how to monitor wowza with prometheus and grafana