Learn how to monitor server and streaming applications in Wowza Streaming Engine™ media server software. Comprehensive metrics deliver real-time data about CPU and memory usage, connection counts, client players, applications, and network statistics.
Contents
Viewing monitoring information Metrics that are collected
Enabling monitoring and statistics
Getting data from HTTP providers
Viewing monitoring information
Wowza Streaming Engine Manager has the following options available to access data and display historic charts in a browser.
Home page
The Home page displays a Connections graph of connection counts that are updated every 5 seconds. This chart contains up to one hour of data and is updated as new samples are requested. The Usage bar chart displays system-level details about Wowza Streaming Engine and are refreshed along with the connection count graph.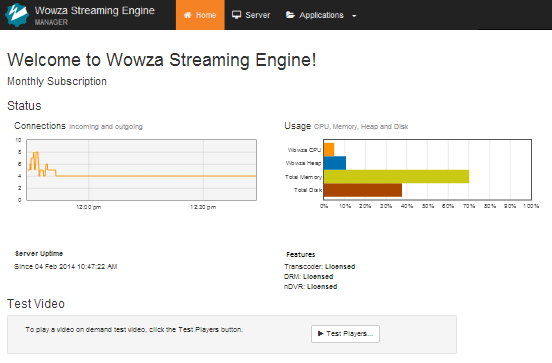
Server monitoring
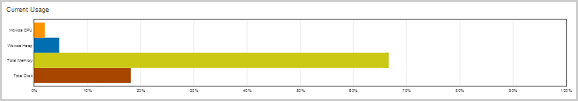
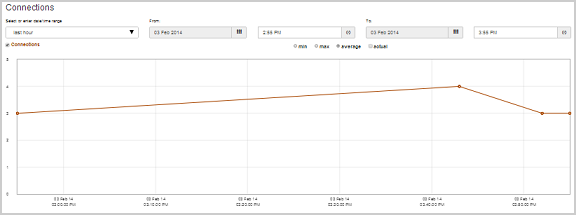
On the Server Monitoring page, the Current Usage bar chart displays current server metrics, refreshed every 5 seconds, with charts for the stored data. The Connections line chart shows historic connection data. This information is refreshed on-demand and doesn't automatically update.
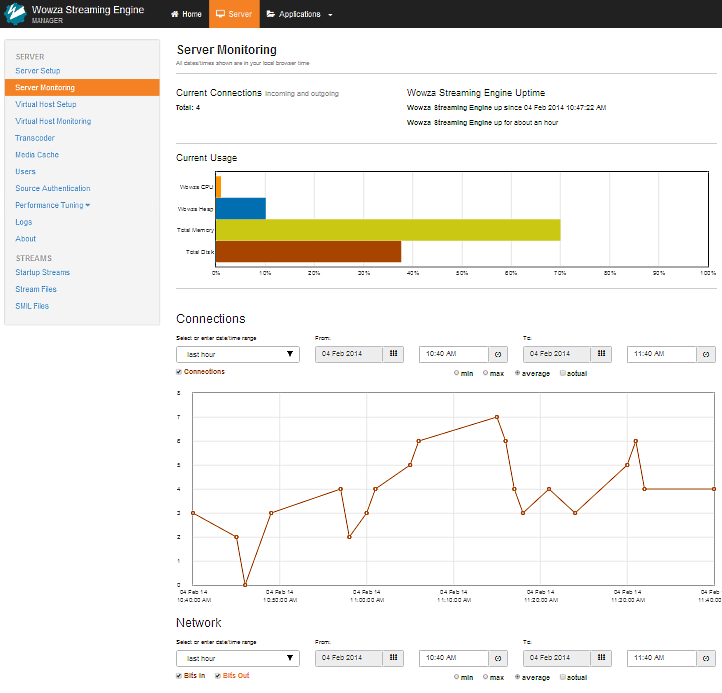
All times are displayed in the user's local time. Wowza Streaming Engine translates to Coordinated Universal Time (UTC) to get the appropriate data.
You can specify that data from a specific date/time range be displayed by selecting a predefined date and time range in a list.
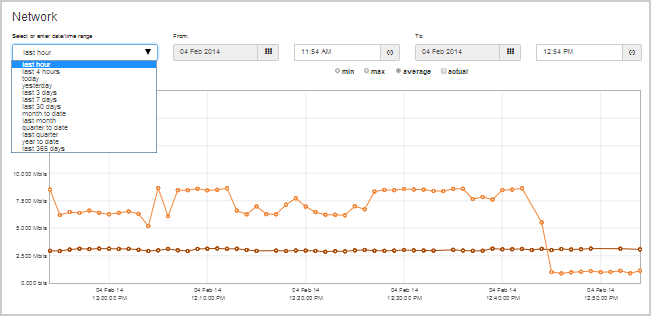
Unless otherwise specified, these selections start from the current time and go backward for the appropriate range. For example, last hour shows data from 60 minutes ago to the current time. If the current time is 10:50, the data range is from 9:50 to 10:50.
Below the date/time range selection are options to show the minimum or maximum values, average values, or actual values of the data.
When you select an hour range and the selected hour occurs no more than 12 hours before the current time, 5-second samples are returned and can be viewed as well. If this criteria is satisfied, you can click the actual option to display the 5-second sample data on top of the currently selected option.
Each chart allows click-and-drag zooming to highlight areas. This won't increase the chart data resolution beyond what's stored. To highlight a section, place the mouse cursor inside the chart at the desired start point, then click, hold, and drag. When you release the mouse, the highlighted section fills the chart area. A Reset button can reset the display to the original range.
The following charts are available on the Server Monitoring page:
Current Usage
Connections
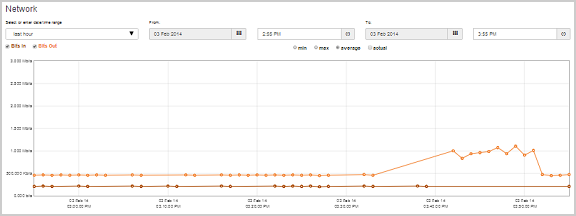
Network
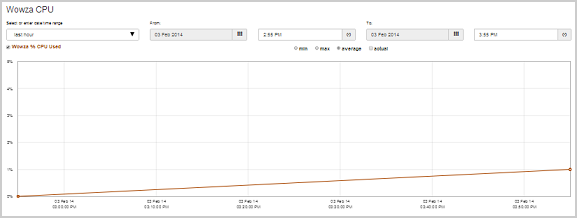
Wowza CPU
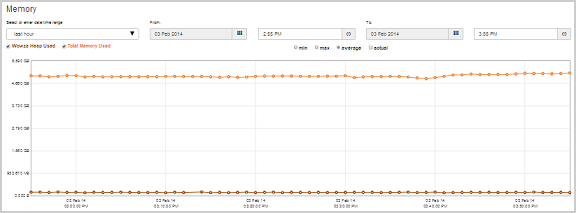
Memory
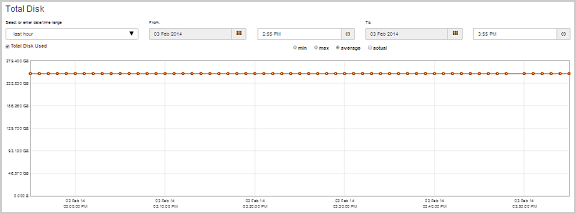
Total Disk
Application and virtual host monitoring
The charts on the Monitoring pages for applications and virtual hosts (VHosts) work the same as the Server monitoring page and use the same metrics.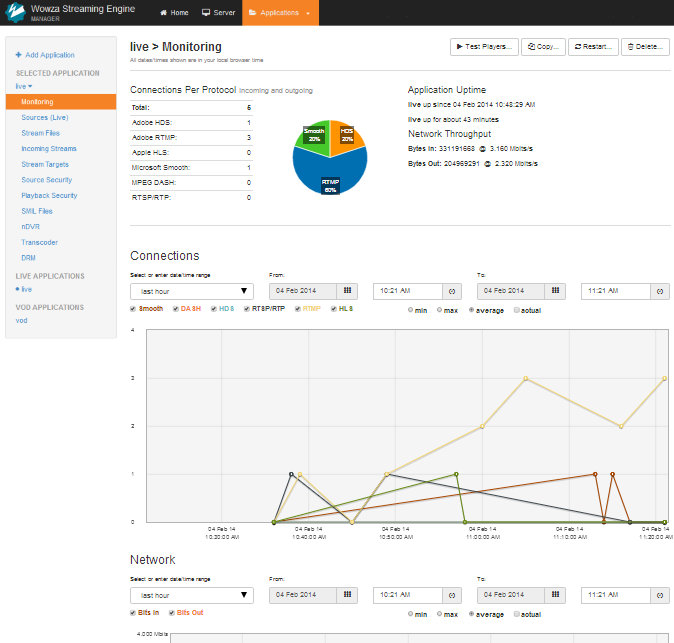
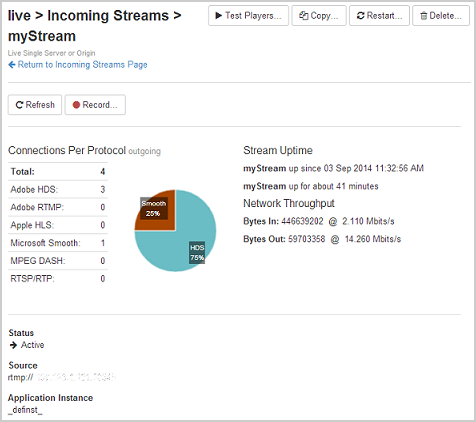
To display incoming stream details when streaming to a live application, click the live application name in the contents panel, click Incoming Streams, and then click the stream name (for example, myStream). This loads a details page that includes current connection, uptime, and network throughput information but no historical data charts.
Metrics that are collected
Wowza Streaming Engine keeps detailed metrics from various server components. Each application and virtual host (VHost) collects and stores the following metrics:
- Connection count by protocol
- Bandwidth in
- Bandwidth out
- Total connection count
- Bandwidth in
- Bandwidth out
- CPU usage of the Wowza Streaming Engine server
- Heap usage of the Wowza Streaming Engine server
- Total memory used
- Total disk used across all drives
Enabling monitoring and statistics
The graphical displays of server and application data are enabled in the Wowza Streaming Engine Manager by default. If they're not showing, you can set an option to display them:
- Click the Server tab at the top of the manager page, and then click Server Setup in the contents panel.
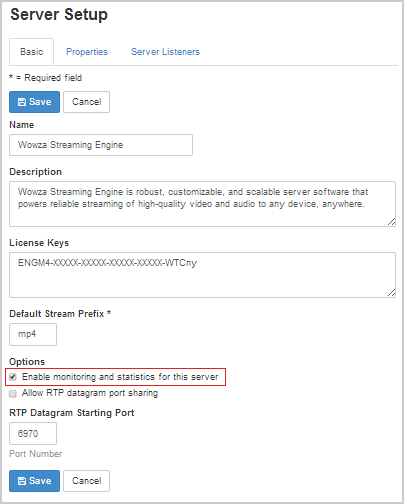
- On the Server Setup page, click Edit.
- Select Enable monitoring and statistics for this server, and then click Save.

Getting data from HTTP providers
You can view statistical data supplied by the following built-in HTTP providers (found in /conf/VHost.xml in a web browser:
HTTPServerInfoXML - (com.wowza.wms.http.HTTPServerInfoXML)
Returns detailed server and connection information in XML format and is available through administrative port 8086 (http://[wowza-ip-address]:8086/serverinfo).
HTTPConnectionCountsXML - (com.wowza.wms.http.HTTPConnectionCountsXML)
Returns detailed connection count information in XML format and is available through administrative port 8086 (http://[wowza-ip-address]:8086/connectioncounts).
HTTPConnectionInfo - (com.wowza.wms.http.HTTPConnectionInfo)
Returns detailed connection information in XML format and is available through administrative port 8086 (http://[wowza-ip-address]:8086/connectioninfo).
Source code for customized output
To build and deploy custom HTTP providers, use the Wowza IDE.
If you want customized output, use the source code for the serverinfo HTTP provider. See How to get detailed server info with an HTTP provider.
To get the source code for the connectioncounts HTTP provider, see How to get connection counts for server, applications, application instances and streams with an HTTP provider.
To see how these HTTP providers are configured for Wowza Streaming Engine, look at the "Admin HostPort" settings in [install-dir]/conf/VHost.xml.
Accessing data from another program
You can use basic, digest, or no authentication to access statistical data from another program. Open [install-dir]/conf/VHost.xml in a text editor and change the AuthenticationMethod in the <HostPort>/<HTTPProvider> container. For example, for the connectioncounts HTTP provider, set the AuthenticationMethod to admin-basic (as in the following code sample), admin-digest, admin-file-digest, or to none:
<HTTPProvider>
    <BaseClass>com.wowza.wms.http.HTTPConnectionCountsXML</BaseClass>
    <RequestFilters>connectioncounts*</RequestFilters>
    <AuthenticationMethod>admin-basic</AuthenticationMethod>
</HTTPProvider>
If you specify admin-basic authentication, you can add your user name and password to the URL:
http://username:pwd@[wowza-ip-address]:8086/connectioncounts