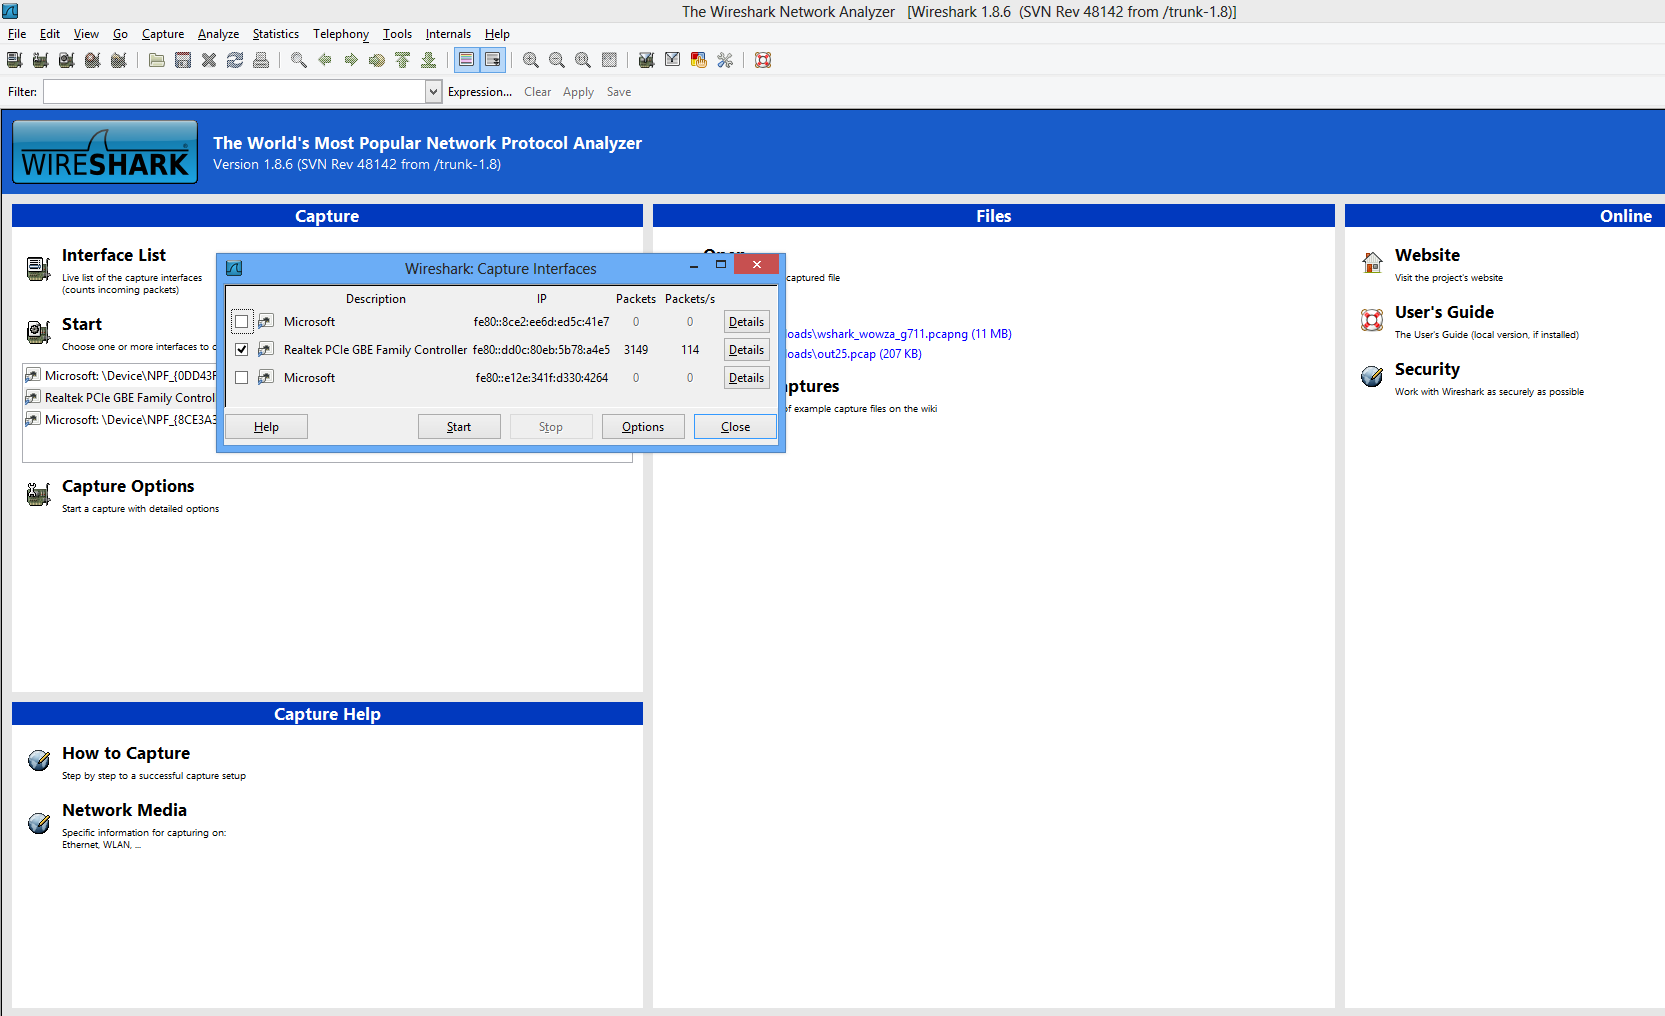
To troubleshoot an incoming MPEG-TS/UDP/RTP/RTSP stream, Wireshark can be a very useful tool. It can capture the traffic on the computer it runs on, and filter/organize incoming/outgoing packets so they can be analyzed easily. To validate that an encoder stream is actually reaching your Wowza Streaming Engine server, it can be useful to capture all incoming/outgoing traffic and identify the data packets coming from the encoder on the configured Wowza port. To perform a network capture when opening the Wireshark tool, you must select on which network interfaces Wireshark should capture the traffic.
After selecting the network interface, click Start so that Wireshark starts capturing incoming and outgoing packets. If your encoder isn't pushing the UDP stream to your Wowza Streaming Engine server yet, you should start it to see the incoming traffic. You should be able to see packets being captured by Wireshark.
You can also capture the network traffic on a Linux-based computer by using the "tcpdump" tool. A sample capturing command would be:
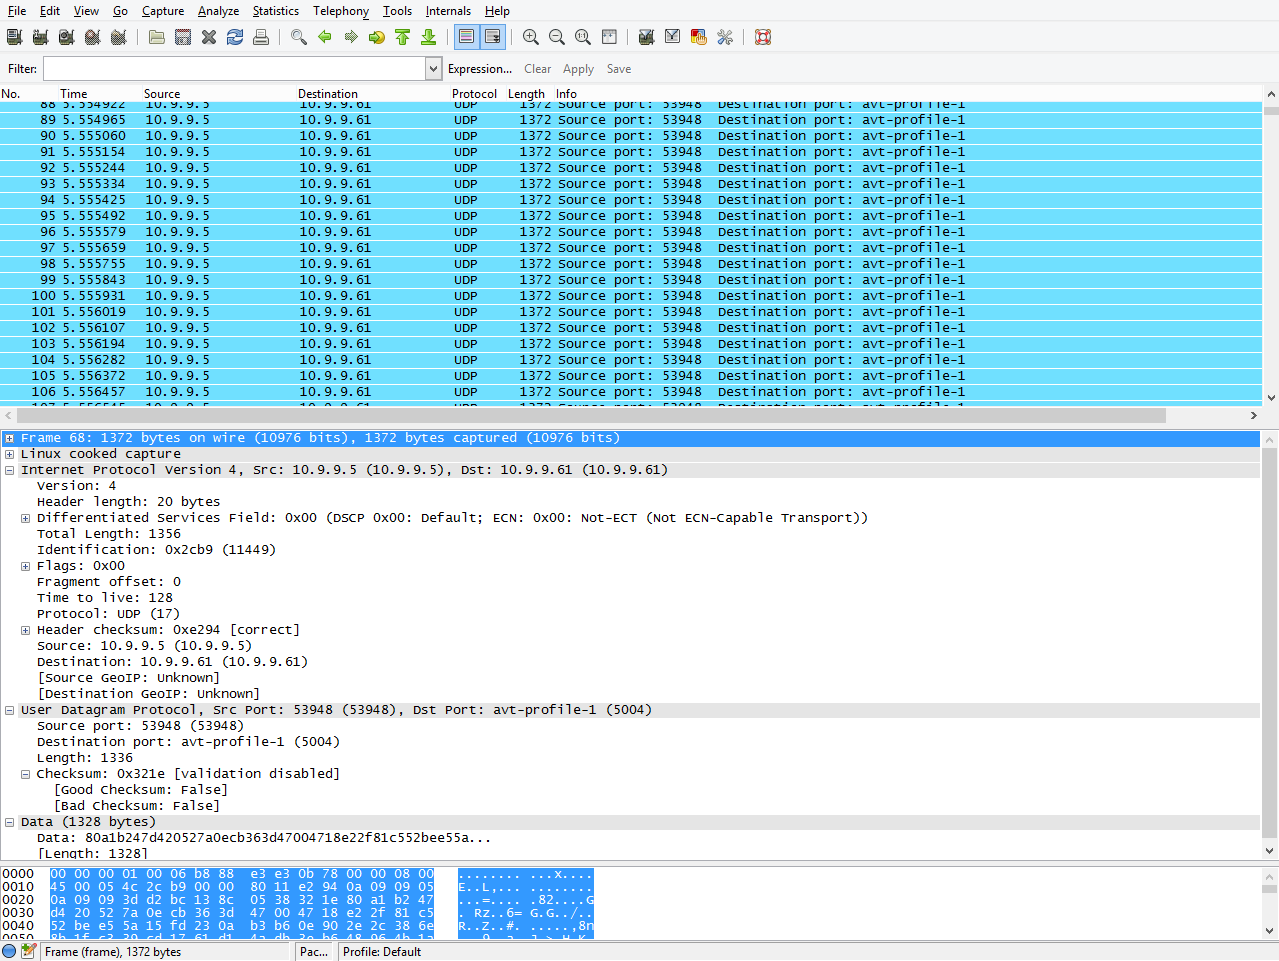
After stopping the network traffic capture (Capture > Stop or CTRL+E), you'll be able to see all captured packets in the Wireshark interface. You can apply filters to isolate only the traffic that's relevant for your investigation. You can find more filters that can be applied here: http://wiki.wireshark.org/DisplayFilters
In the following figure, you can see that UDP packets from the encoder (10.9.9.5) are being received by the media server (10.9.9.61) on port 5004.
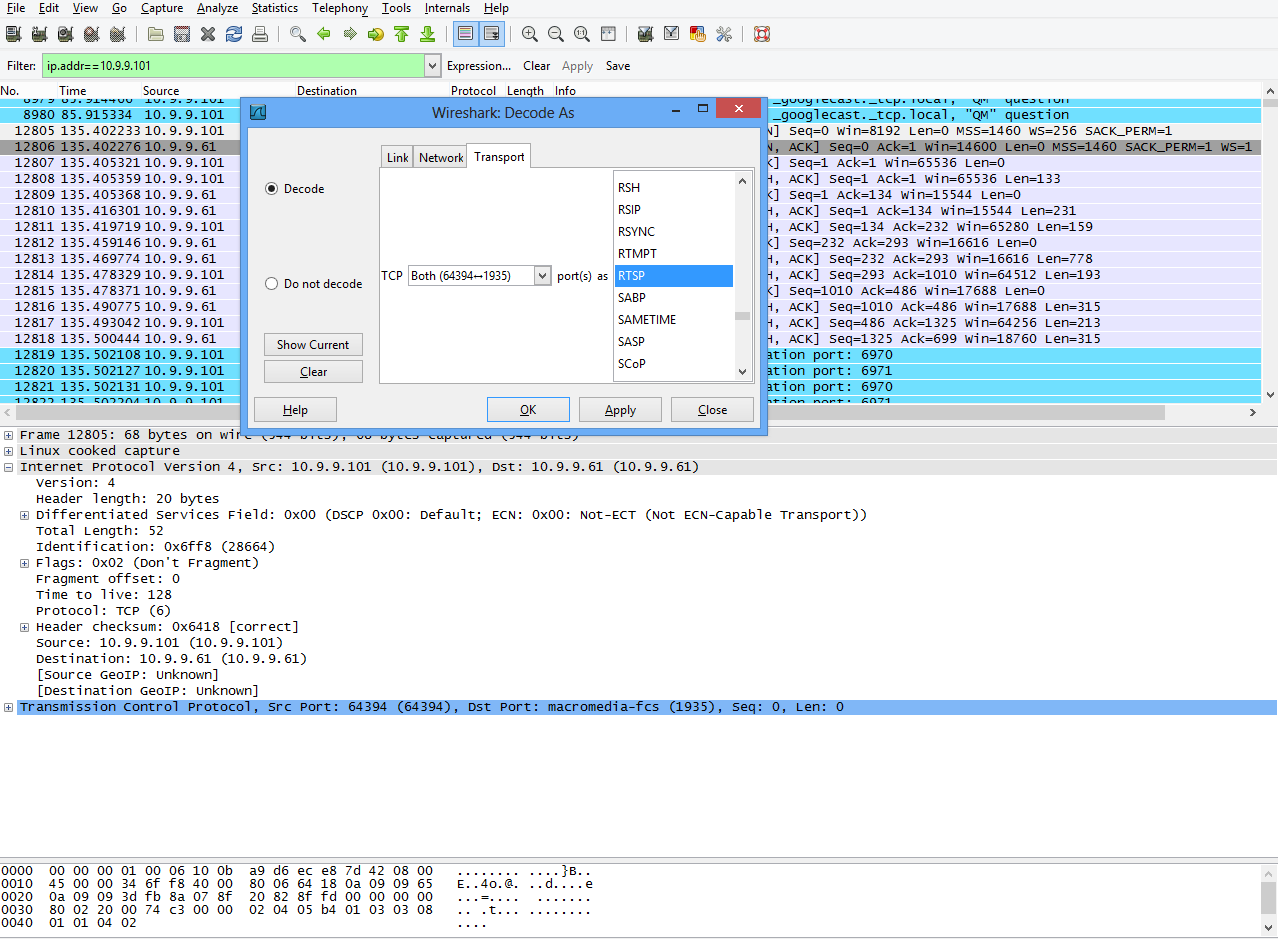
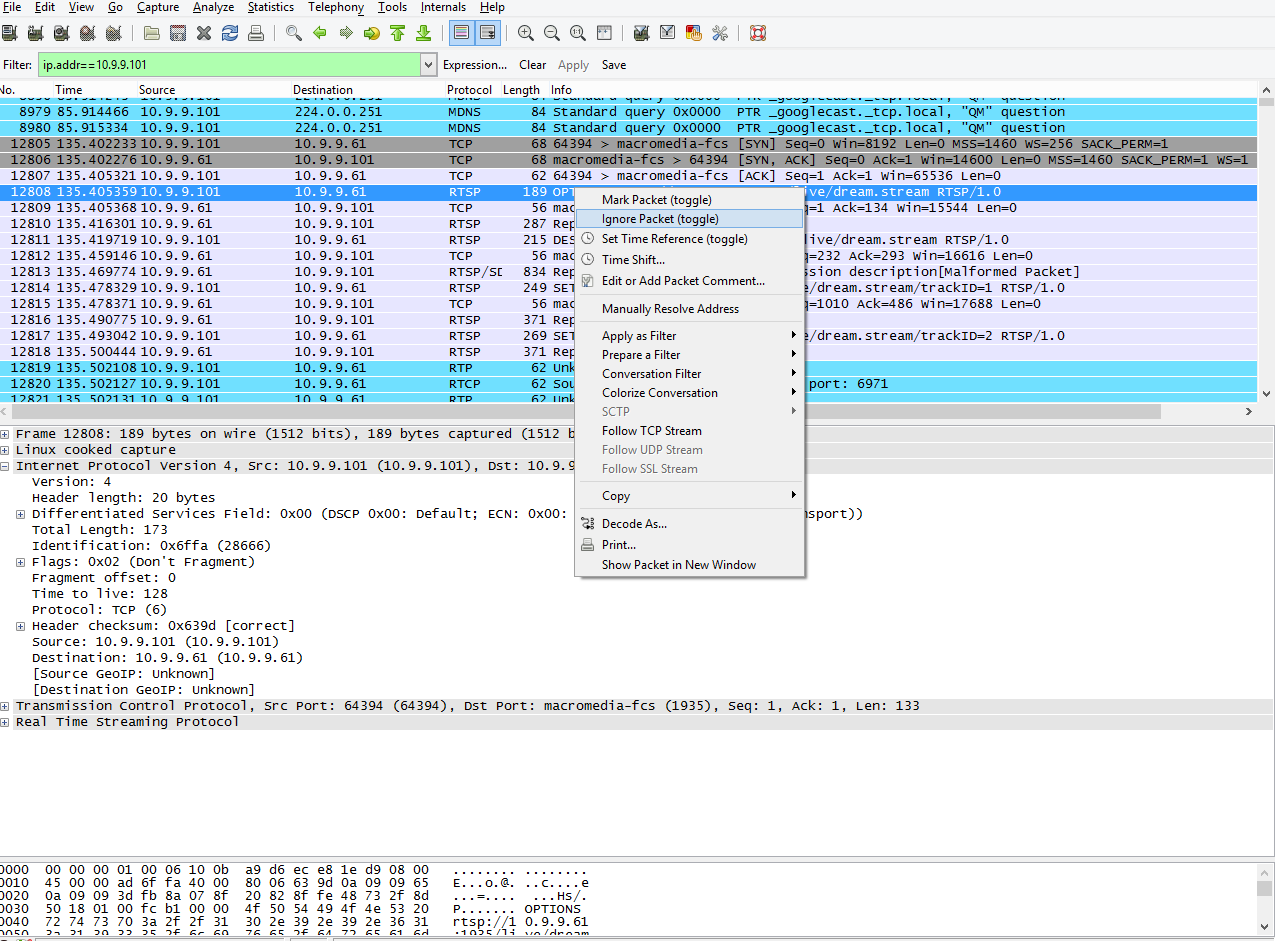
To debug RTSP client playback issues, you can filter out the traffic coming and going from/to that particular client IP address, if you know the IP address of the playback client. Sometimes, not all packets are decoded correctly. To address this concern, select a particular packet, in this case a request going from the client to the server on port 1935, and choose the Decode as: RTSP option. You can do this because you know that this should be an RTSP message exchange. You can get the context menu and dialog box shown in the following figures by right-clicking on a particular packet line, and then choosing the Decode as option.

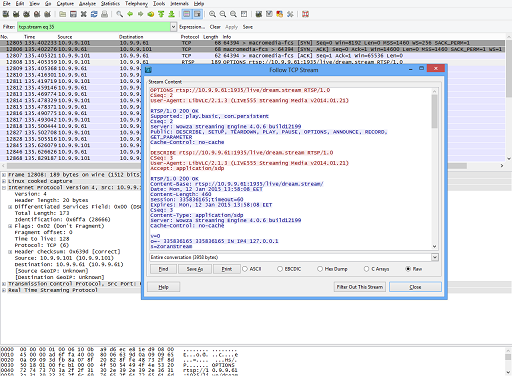
To follow the RTSP exchange between the client and the media server, right-click on a selected RTSP-decoded TCP packet, and then select the Follow TCP stream option. You'll then be presented with all the communication message exchanges between the client and the media server. See the following figures:
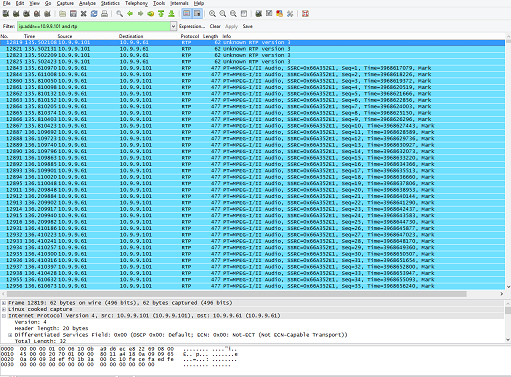
Another thing that might help in debugging an RTSP streaming session would be to verify that all RTP packets are being sent by the media server in the correct order. To check that you can filter out only the RTP packets, apply a similar filter (in this case, the client playback IP address is 10.9.9.101: ip.addr == 10.9.9.101 and rtp), and then verify that all outgoing RTP packets of the same RTP type (one RTP type for audio and one RTP type for the video track) have consecutive sequence numbers. Packets shouldn't be sent out of order. A high sequence number shouldn't arrive before a lower sequence number. If the player is running on a computer, you might also want to take a network capture on the receiving end and compare with the data from the sender end.
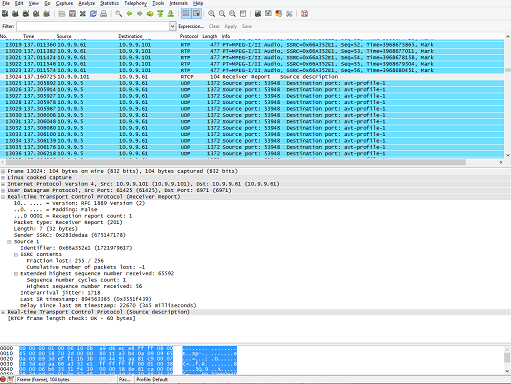
You can also verify the RTCP receiver reports sent by the client and sender reports sent by the media server. In receiver reports, you can get the number of the last RTP packet reported as received by the client and verify that against the list of received RTP packets displayed by Wireshark. The receiver reports also inform you about how many RTP packets were lost and the average jitter time. In sender reports, you can get the sequence number of the last RTP packet reported as sent by the media server and verify that against the list of sent RTP packets displayed by Wireshark.